
Make plots in academic papers
Published:
This is example plots by $\LaTeX$ package tikz.
Markov Transition Diagram
Plot
This is a Markov transition diagram for queueing system. 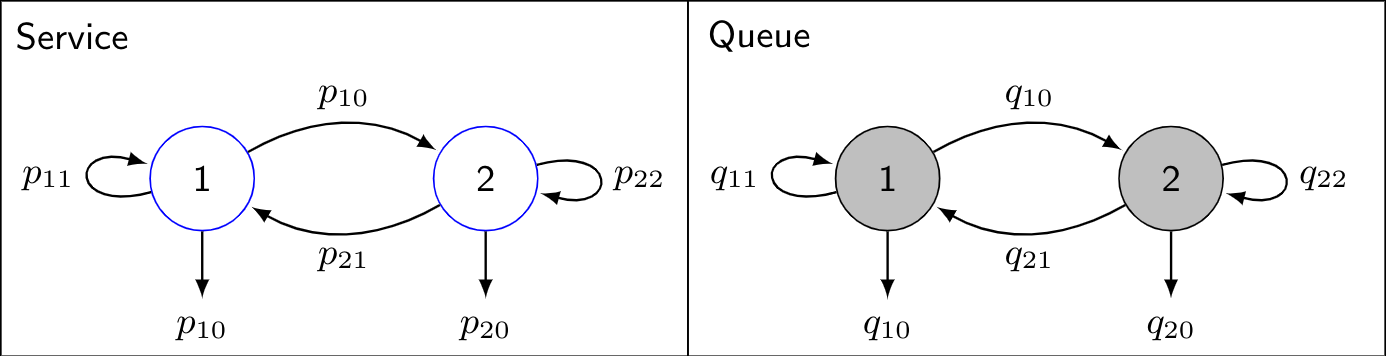
Codes
\documentclass{standalone}
\usepackage{tikz}
\usetikzlibrary{automata,positioning,calc}
\usepackage{color}
\definecolor{gray97}{gray}{.97}
\definecolor{gray75}{gray}{.75}
\definecolor{gray45}{gray}{.45}
\begin{document}
\begin{tikzpicture}[font=\sffamily\small]
% Add states for those in service
\node[state,
        text=black,
        draw=blue] (s1) {1};
\node[draw=none, below=.6cm of s1]   (s1exit)   {$p_{10}$};
\node[state,
        right=1.5cm of s1,
        text=black,
        draw=blue,
        fill=none] (s2) {2};
\node[draw=none, below=.6cm of s2]   (s2exit)   {$p_{20}$};

% Connect the states with arrows
\draw[every loop,
auto=none,
line width=.2mm,
>=latex,
draw=black,
fill=none]
    (s1) edge[bend left, auto=left]  node {$p_{10}$} (s2)
    (s1) edge node {} (s1exit)
    (s2) edge node {} (s2exit)
    (s2) edge[bend left, auto=left] node {$p_{21}$} (s1)
    (s1) edge[loop left]             node {$p_{11}$} (s1)
    (s2) edge[loop right]             node {$p_{22}$} (s2);
\draw[black] ($(s1)+(-1.7,-1.5)$) rectangle (4.1,1.5) node[xshift=-5.2cm,yshift=-.3cm]{Service};

% Add states for those waiting in queue
\node[state,
        right=2.5cm of s2,
        text=black,
        draw=black,
        fill=gray75] (q1) {1};
\node[draw=none, below=.6cm of q1]   (q1exit)   {$q_{10}$};
\node[state,
        right=1.5cm of q1,
        text=black,
        draw=black,
        fill=gray75] (q2) {2};
\node[draw=none, below=.6cm of q2]   (q2exit)   {$q_{20}$};

% Connect the states with arrows
\draw[every loop,
auto=none,
line width=.2mm,
>=latex,
draw=black,
fill=none]
    (q1) edge[bend left, auto=left]  node {$q_{10}$} (q2)
    (q1) edge node {} (q1exit)
    (q2) edge node {} (q2exit)
    (q2) edge[bend left, auto=left] node {$q_{21}$} (q1)
    (q1) edge[loop left]             node {$q_{11}$} (q1)
    (q2) edge[loop right]             node {$q_{22}$} (q2);
\draw[black] ($(q1)+(4.2,-1.5)$) rectangle (4.1,1.5) node[xshift=.6cm,yshift=-.3cm]{Queue};
\end{tikzpicture}
\end{document}
ED Patient Flow
Plot
This is a plot of patient flow in hospital emergency department. 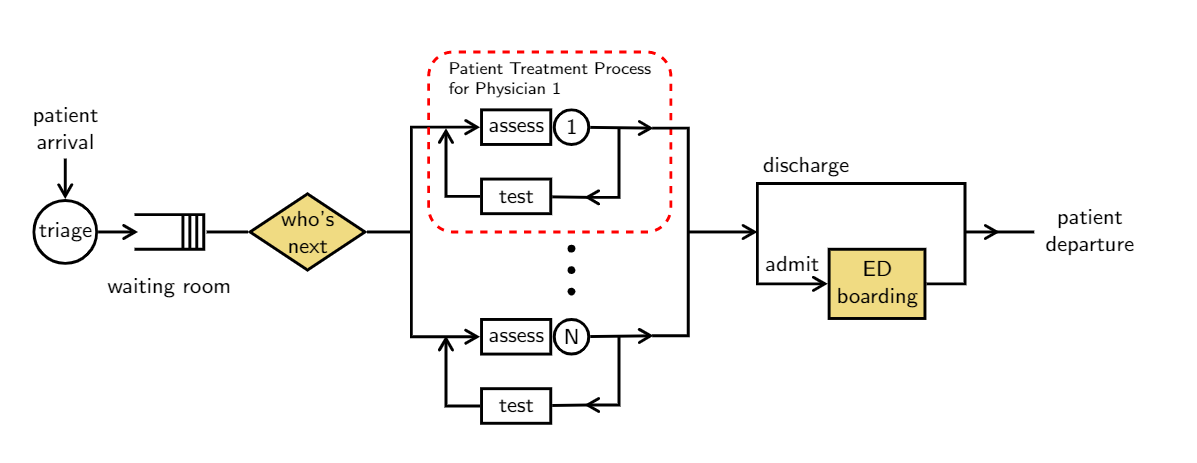
Codes
\documentclass[tikz,14pt,border=10pt]{standalone}
\usepackage{textcomp}
\usepackage{tikz}
\usetikzlibrary{shapes,arrows,arrows.meta,decorations.shapes}
\usetikzlibrary{automata,calc,positioning}
\definecolor{flax}{rgb}{0.93, 0.86, 0.51}
\definecolor{buff}{rgb}{0.94, 0.86, 0.51}
\definecolor{bluegray}{rgb}{0.4, 0.6, 0.8}
\definecolor{carolinablue}{rgb}{0.6, 0.73, 0.89}

%Definition of blocks:
\tikzset{
block/.style = {draw, rectangle, minimum width=1cm, align=center, inner sep=0pt, minimum height=5mm},
order/.style = {draw, circle, node distance=8mm, inner sep=1pt, minimum size=5mm},
decision/.style = {fill, diamond, aspect=1.5, draw=black, fill=buff,text=black, inner sep=0pt, minimum size=5mm},
string/.style = {draw=none, inner sep=0, align=center, font=\sffamily\scriptsize\bfseries},
pics/Room/.style args={#1}{
    code={
    \draw [very thick] (0,0) -- (1,0) -- (1,-0.5) -- (0,-0.5);
    \draw [very thick] (0.9,0) -- (0.9,-0.5);
    \draw [very thick] (0.8,0) -- (0.8,-0.5);
    \draw [very thick] (0.7,0) -- (0.7,-0.5);
    \node[draw=none, thick, minimum width=8mm, minimum height=5mm] () at (0.6,-0.25) {#1};
  }},
dots/.style 2 args={decorate,decoration={shape backgrounds,shape=circle,shape size=#1,shape sep=#2}}
}

\begin{document}

\begin{tikzpicture}[auto, very thick, node distance=2cm, font=\sffamily\small]

\draw
    node [order](triage){triage}
    node [draw=none, above of=triage, yshift=-5mm, align=center](patient){patient \\ arrival}
    node (waitRm) [right of=triage, inner sep=0, xshift=-5mm]{
        \begin{tikzpicture}
            \draw (0,0) pic{Room};
        \end{tikzpicture}
    }
    node [draw=none, below of=waitRm, yshift=12mm, align=center](){waiting room}
    node [decision, right of=waitRm, xshift=0mm, align=center, font=\sffamily\small](next){who's \\ next}
    node [block, above right of=next, xshift=16mm, yshift=1mm](assess){assess}
    node [order, right of=assess](1){1}
    node [block, below of=assess, yshift=1cm](test){test}
    node [block, below right of=next, xshift=16mm, yshift=-1mm](assessN){assess}
    node [order, right of=assessN](N){N}
    node [block, below of=assessN, yshift=1cm](testN){test}
    node [block, fill=buff, above right of=assessN, align=center, inner sep=3pt, minimum height=1cm, xshift=3.8cm, yshift=-6.5mm, font=\sffamily\small](boarding){ED \\ boarding}
;

% Waiting phase
\draw[-{angle 60}] (patient) -- (triage);
%\draw[-{angle 60}] (triage) -- (waitRm);
\draw[-{angle 60}] (triage) -- (1.05,0);
\draw[-] (waitRm) -- (next);
\draw[-] (next) -- (5,0);
\draw[-{angle 60}] (5,0) |- (assess);
\draw[-{angle 60}] (5,0)|- (assessN);

% Treatment phase
\draw[dashed, rounded corners=10pt, color=red, very thick] (5.25,0) rectangle (8.75,2.6);
\node[string, align=left, font=\sffamily\scriptsize] (physician) at (7, 2.2){Patient Treatment Process\\for Physician 1};
\begin{scope}[xshift=8cm, on grid]
% Physician 1
\draw[-{angle 60}] (1) -- (0.5,1.5);
\draw[-{angle 60}] (0,1.5) |- (-0.5,0.5);
\draw[-] (-0.45,0.5) -- (test);
\draw[-{angle 60}] (test) -| (-2.5,1.5);
\draw[-] (0.48,1.5) -| (1,0);
% Physician N
\draw[-{angle 60}] (N) -- (0.5,-1.5);
\draw[-{angle 60}] (0,-1.5) |- (-0.5,-2.5);
\draw[-] (-0.45,-2.5) -- (testN);
\draw[-{angle 60}] (testN) -| (-2.5,-1.5);
\draw[-] (0.48,-1.5) -| ((1,0);

\draw[-{angle 60}] (1,0) -- (2,0);

% Boarding
\draw[-{angle 60}] (2,0) |- (boarding);
\draw[-] (2,0) -- (2,0.7) -- (5,0.7) |- (boarding);
\draw[-{angle 60}] (5,0) -- (5.5,0);
\draw[-] (5.45,0) -- (6.0,0);
\path let \p1 = (1) in node (point1) at (\x1,-0.1) {} node(point2) at (\x1,-1) {};
\draw[dots={2pt}{3.1mm}, fill] (point2) -- (point1);
\draw
    node [string, font=\sffamily\small] (discharge) at (2.7,0.95) {discharge}
    node [string, font=\sffamily\small] (admit) at (2.5,-0.45) {admit}
    node [string, font=\sffamily\small] (depart) at (6.8,-0) {patient\\departure}
;
\end{scope}

\end{tikzpicture}

\end{document}